Facility Overview
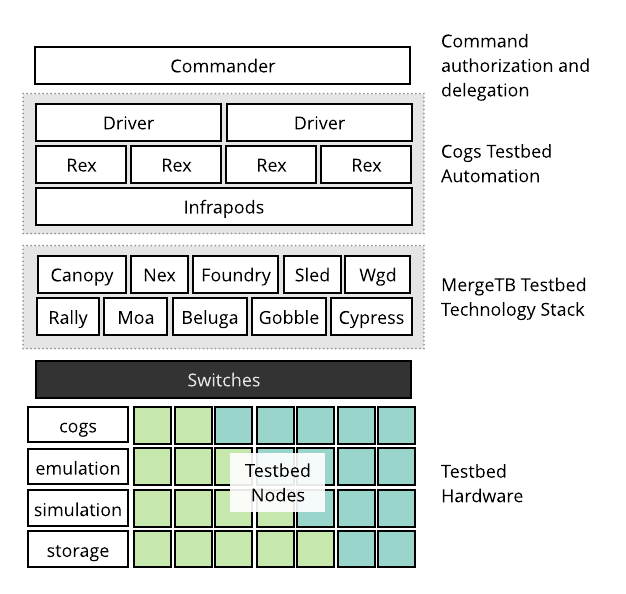
A Merge-based testbed is a testbed facility built using the Merge technology stack and automation systems. A Merge testbed is made up of a distributed set of modular components that communicate over well defined interfaces and come together in a layered architecture.
The command layer is responsible for authenticating and authorizing requests from Merge portals and delegating them to the appropriate drivers in the testbed automation system.
The automation layer is responsible for building and executing task graphs from materialization requests. The automation layer knows very little about how to actually accomplish materialization tasks, it relies on individual components from the Merge technology stack to accomplish this.
The testbed infrastructure layer is comprised of a set of narrowly focused subsystems that are responsible for carrying out materialization tasks. This includes things like node imaging systems and DHCP/DNS servers.
The fabric layer is compirsed of the switches, routers and network appliances that collectively interconnect the testbed.
The resource layer is comprised of the user-allocatable resources that underpin materializations. This includes physical devices and virtual devices running inside hypervisors.
Hardware
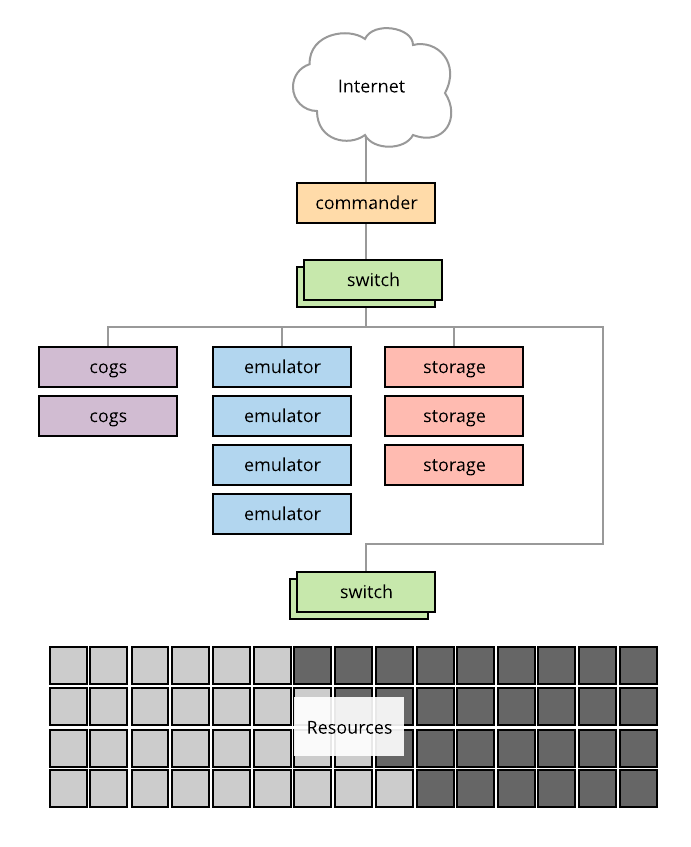
The diagram below shows a typical Merge testbed facility.
The commander server is connected to both the upstream network and the testbed network. In this setup there are a pair of "Cogs" nodes that host the testbed automation layer and parts of the testbed infrastructure layer. We refer to these machines as Cogs as this is what the name of the Merge automation system is. The emulator servers provide network emulation services. The strorage servers host the testbed databases and mass storage systems.
Merge testbeds are typically composed of three physical networks.
- A management network for direct hardware access that interconnects all the infrastructure level servers described above, as well as the management ports of switches.
- An experiment infrastructure network that interconnects all testbed nodes, with access ports on cogs and storage servers. This network is commonly referred to as the infranet.
- A data network that interconnects all testbed nodes, with access ports on emulation servers.
The choice of how the software elements that comprise a Merge testbed are deployed across a hardware substrate are at the discretion of the testbed operator. In this document, we'll organize things around the logical components and give guidance on appropriate deployment strategies as we go. As a quick point of reference for those seeking guidance on deployment strategies. A typical deployment of the Merge software components onto the hardware substrate depicted above is as follows.
| server | components |
|---|---|
| commander | commander |
| cogs | driver, rex, infrapods, wgd, beluga, gobble |
| emulator | gobble, moa |
| storage | gobble, rally, sled |
| switch | canopy |
Commander
The Merge commander is responsible for authenticating requests from a Merge portal and delegating them to the appropriate drivers in the testbed facility. When the commander starts, it exposes two endpoints, one to the portal and one to drivers within the facility. When drivers come online, they contact the driver and register all the resources for which they want commands delegated to them. The driver builds a lookup table where resource IDs are the keys and the values are lists of drivers.
Materialization requests that come in from the portal come in two types.
- Materialization notifications notify a facility that a materialization is
about to be set up (
NotifyIncoming), or that it is OK to discard a materialization (NotifyTeardown). - Materialization requests are messages composed of materialization fragments. Each fragment has a resource id to which it refers and an operation to perform over that resource id. For example, a materialization fragment may contain the resource ID of a node, and a request to recycle that node to a clean state. These requests typically come in batches of fragments for efficiency.
Installation
The Merge Commander is installed from the Merge package server,
using the mergetb-commander package.
Once installed the commander runs as a systemd service.
Configuration
The is no explicit configuration file for the commander. It does have some flags that can modify its behavior
| flag | default | purpose |
|---|---|---|
listen | 0.0.0.0 | address to listen on |
port | 6000 | port to listen on |
cert | /etc/merge/cmdr.pem | client access certificate Merge portals must use to access the materialization interface |
key | /etc/merge/cmdr-key.pem | private key corresponding to the client certificate |
Driver
The Merge Driver is responsible for taking delegated materialization requests from a commander and transforming them into a task graph in preparation for execution. This task graph is a directed acyclic graph that captures the dependencies between materialization tasks so they can be maximally parallelized for execution.
Here is a sample execution graph in tabular form.
In addition to having a basic DAG structure, tasks are also organized into stages and actions. Stages are executed in serial, and actions are executed in parallel. So in a way stages act like execution barriers.
To get a sense for how the above all comes together logically consider the graphical representation of the table above in the diagram below. Here the blue rectangles are tasks, each column within the rectangle is a stage and each rounded rectangle is an action.
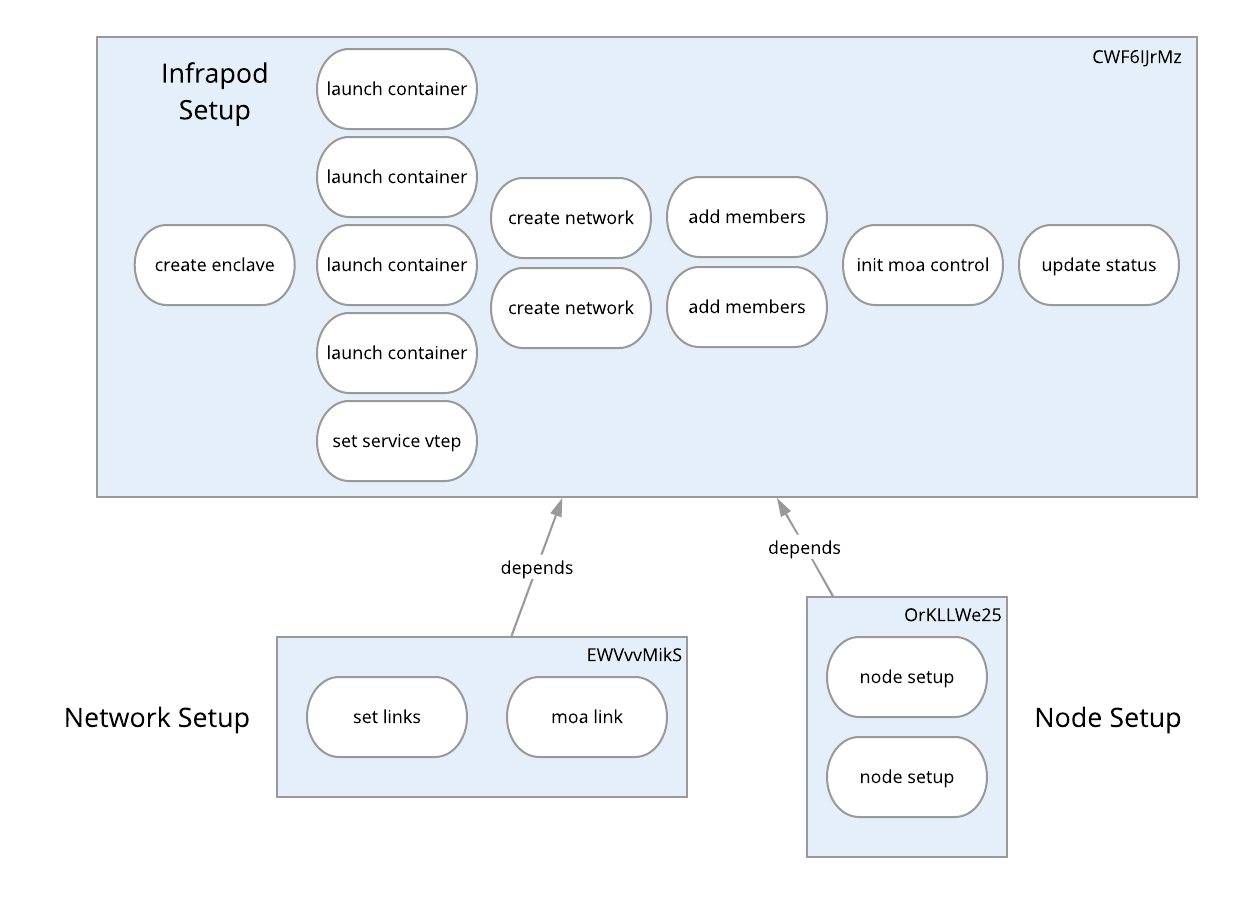
Here we see that this materialization is broken up into three tasks for
- Setting up the infrapod and it's network enclave.
- Setting up the experiment network.
- Setting up the nodes.
Within the infrapod setup there is a single action in the first stage that creates the network enclave for the infapod. Once that action is complete the next stage is executed. In this stage 4 containers are launched and a service VXLAN tunnel endpoint (VTEP) is set up. All of these actions are done in parallel. Next DHCP/DNS networks are created that provide names and addresses on the experiments infranet. Members are then added to the DHCP/DNS networks. The network emulation (moa) control container is initialized and a global status for the materialization is updated indicating that the infrapod has been set up.
Once the infrapod is setup, the two tasks that depend on in, network setup and node setup are executed. The network setup happens across two actions in serial across two stages and the node set up happens in parallel across all nodes in the materialization. In this case we have a tiny two node experiment.
Tasks are stored in the facility etcd database discussed later in this document.
Installation
The Merge Driver is installed from the Merge package server,
using the mergetb-driver package.
Once the driver is installed, it runs as a systemd service.
Configuration
The driver configuration file is located at /etc/cogs/driver.yml. Here is an
example configuration.
Rex
The Driver is only responsible for creating the task graph structure. It is not responsible for managing task execution. That job falls to a component called Rex. Rex continuously watches the etcd database for new tasks or changes in existing task state that may make other tasks eligible for execution.
Installation
The Merge Rex execution agent is installed from the
Merge package server, using the mergetb-rex package.
Once rex is installed, it runs as a systemd service.
Configuration
The rex configuration file is located at /etc/cogs/driver.yml. here is an
example configuration.
Cog
The cog command line tool is the primary tool used to operate a testbed
facility.
Monitoring Task Progress
Use this command to see what tasks are currently pending on the testbed
Viewing Materialization Tasks
Use this command to view the tasks of a specific materialization. Use the
--all flag to show tasks that have been completed in addition to pending
tasks.
note
The mzid of a materialization is denoted by
<realizaton>.<experiment>.<project>
Clearing Task Errors
When a task encounters an error and needs to be retried, either because the operations team has fixed some piece of infrastructure or the error appears to be transient use this command to clear the task error so Rex will try the task again. Rex ignores all tasks that have an error condition.
Manually Completing Tasks
Sometimes a task is in a hopeless state and the ops team just needs to consider it complete and move on so other dependent tasks and stages can be executed.
Masking Actions
Sometimes an action needs to be masked so it won't be executed when Rex gets to that point in the execution graph. This is what masking is for. When a task is masked Rex will ignore it. It also allows execution to continue beyond the point of the task in the graph, as masked tasks are discarded as a dependency consideration.
Manual Dematerialization
Sometimes an experiment must be manually dematerialized. The most common reason for this is a de-synchronization between a Merge portal and the testbed facility.
This will dematerialize the experiment and clear out all associated data records from the Cogs database.
Listing Materializations
To get a list of all active materializations
Showing Materialization Info
This is probably the second most useful command for managing testbed facilities.
Taking the highlights section by section, this command shows
- the overall
statusof the materialization asactive - the service address of the infrapod as
172.31.0.127 - all the containers in the infrapod are up
- There are two nodes with the
debian:10image that have active DHCP leases with 2 hours and 3 minutes remaining. - What switches each node interface is connected to on both the infranet and xp net as well as VLAN/VXLAN information.
- A mapping of experiment links from node to node including all the intermediate switch hops and the VLAN/VXLAN information associated with them.
- EVPN advertisement information for cross-fabric or emulated links.
note
We say that a link is cross fabric when it transits across at least one routed VXLAN hop.
Getting Node State
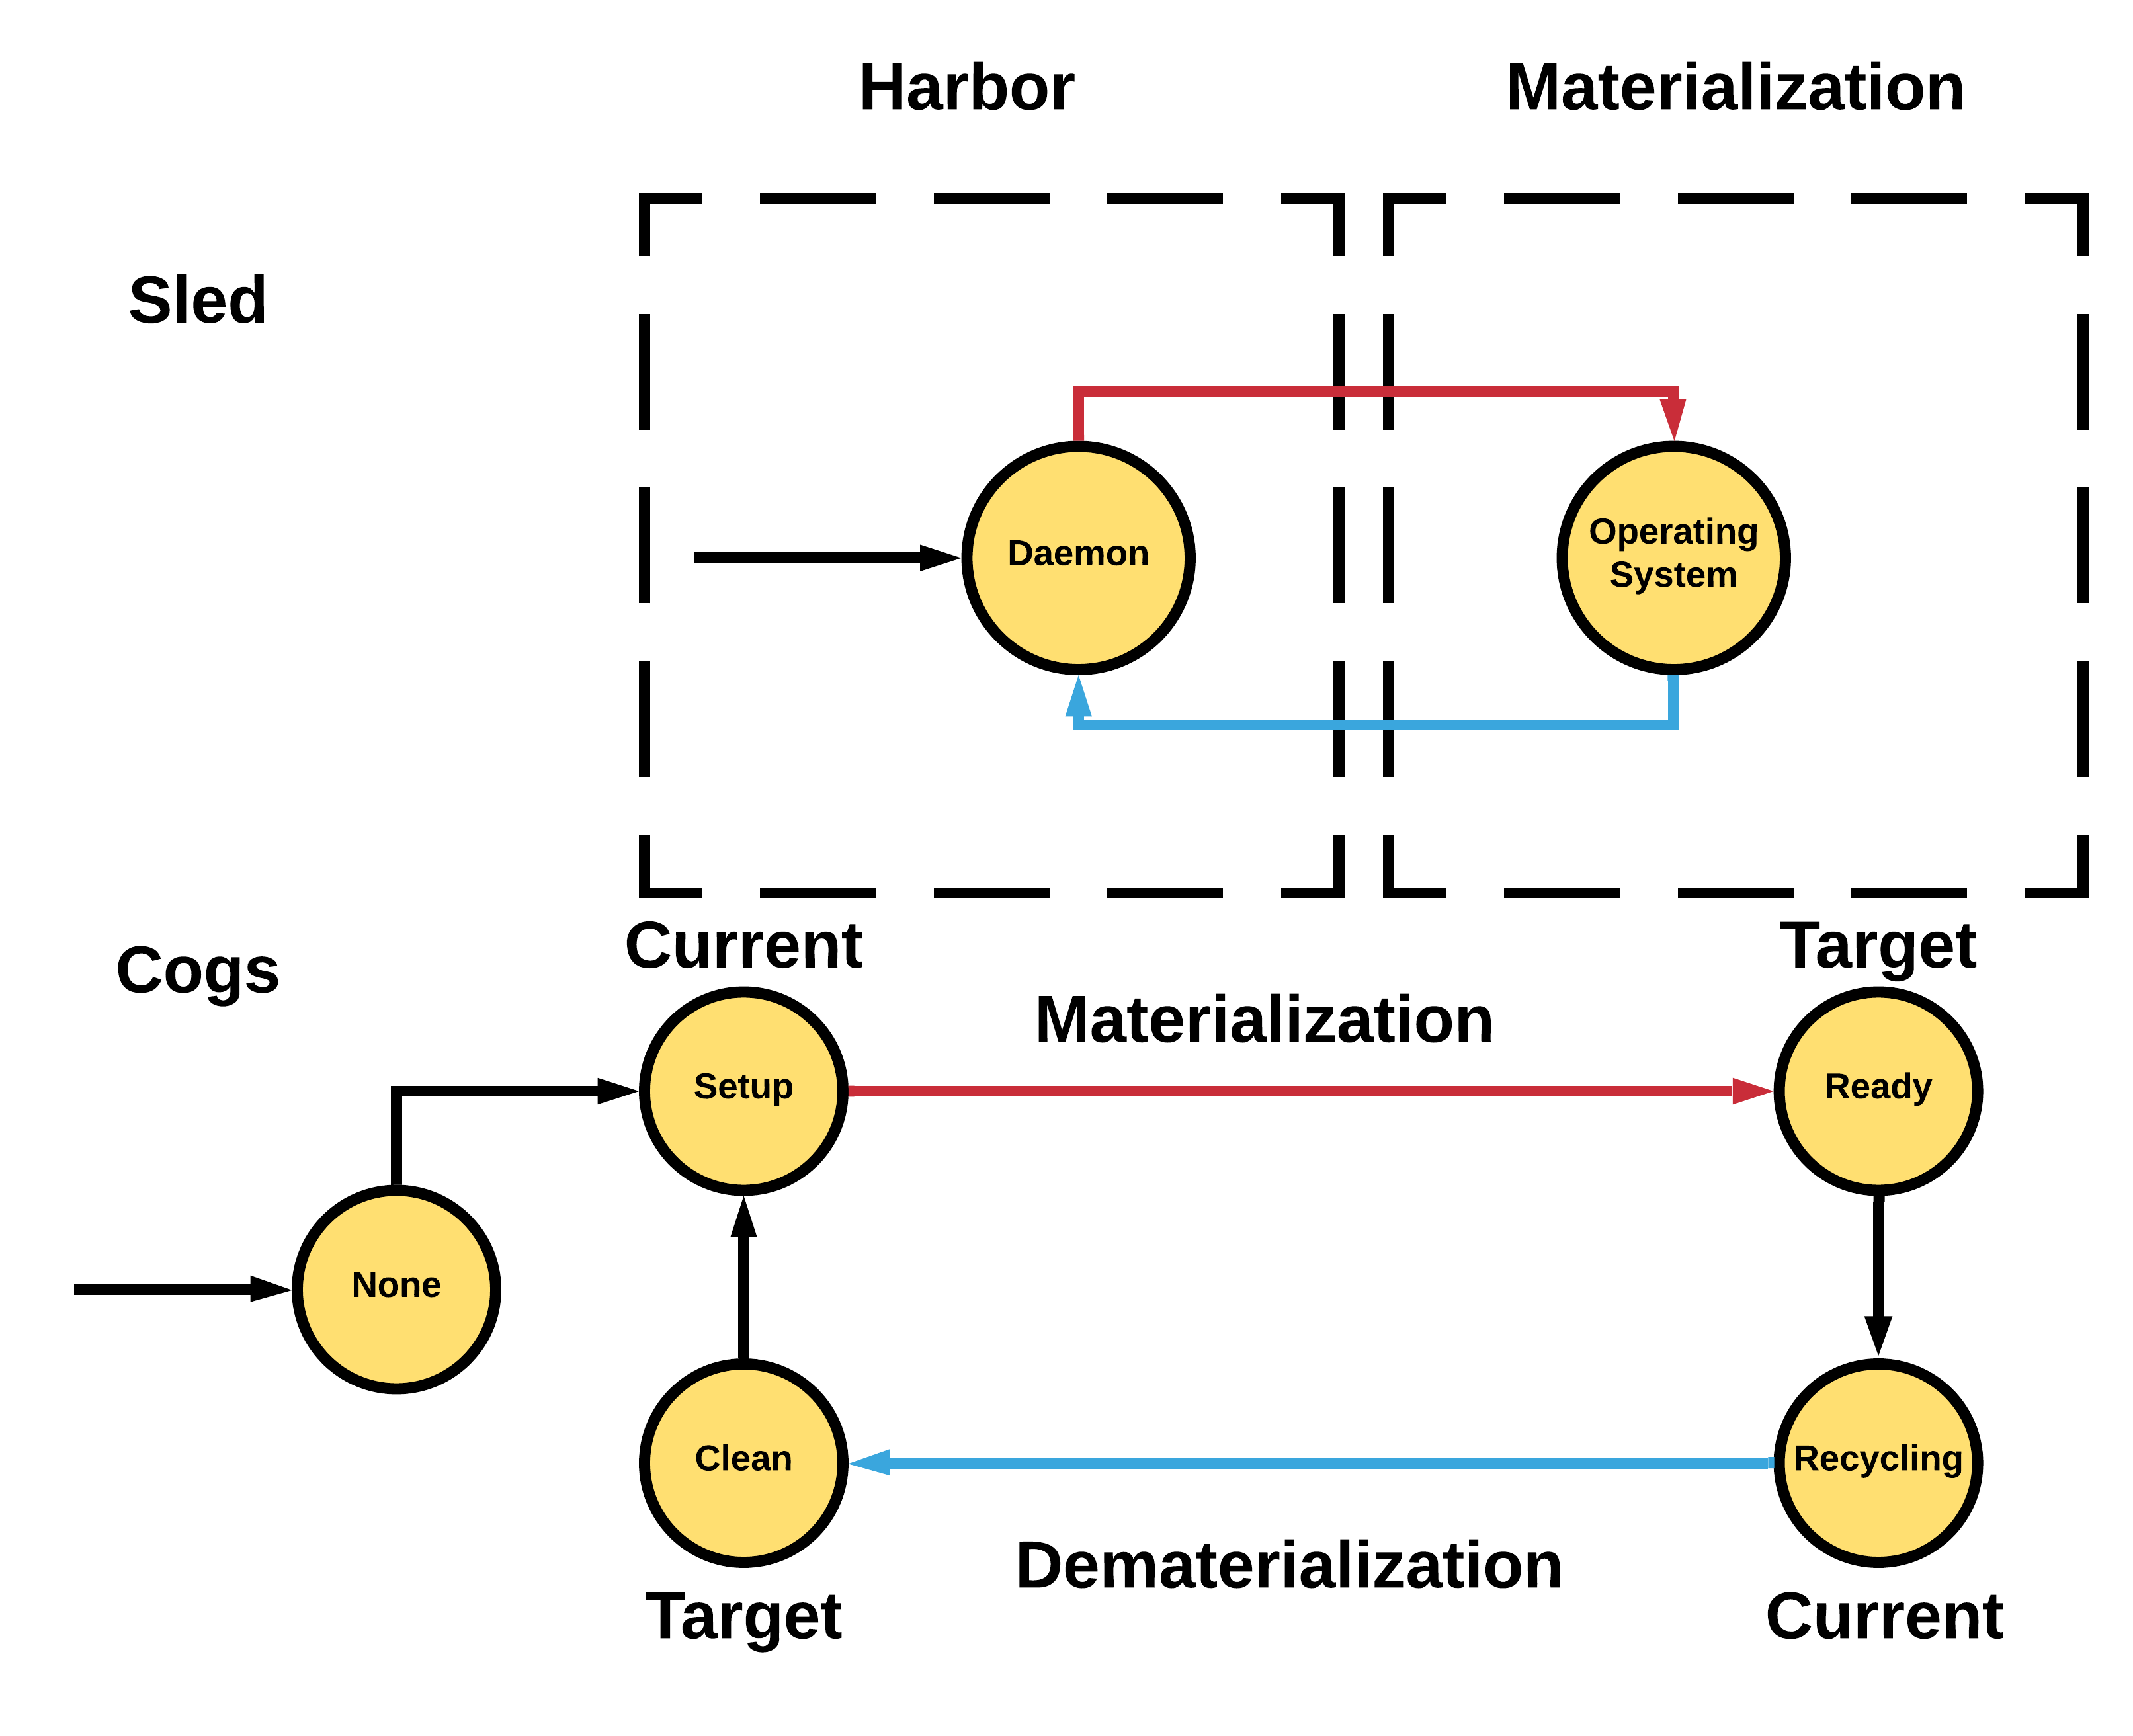
The above image shows some of the internals for node status and sled state. Rex is the driver of state. During a materialization, a node will move from the Clean state to Setup to Ready. Rex manages the state machine transition and prevents nodes from getting into bad states; always driving from current state to target state. Clean and Ready states can be easily mapped to sled states when the node is in Daemon mode (Clean) or is in a Materialization (Ready). Sled states will be discussed in later sections.
You can use cog list nodes to detect issues with nodes where the current state != target state and are not materializing or dematerializing.
Infrapods
Infrapods are a collection of containers that provide per-experiment infrastructure. Each infrapod contains the following containers at a minimum
- Foundry: node configuration daemon
- Nex: DHCP/DNS server
- Etcd: Database for infrapod local storage
Optionally infrapods may contain
- Moactld: for dynamic network emulation modification.
- Simctld: for physics simulation control.
depending on the composition of the experiment.
Technically, an infrapod is a network namespace that contains the above collection of containers. This is similar to the Kubernetes Pod abstraction. Infrapods are created during the materialization initialization phase for every experiment. In addition to a set of pods contained within a network namespace, there are also a set of interfaces that are created within the network namespace for
- communication with testbed resources on the infranet
- communication with testbed automation systems on the management network
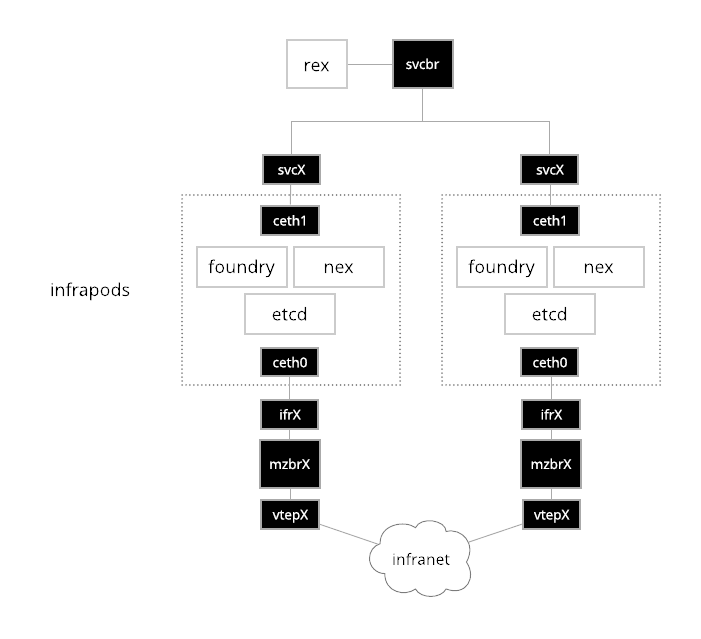
The diagram above shows the network plumbing for two simple infrapods. On the
'top half' of the network the ceth1 interface of the infrapod connects to a
service bridge that testbed automation tools like Rex use to communicate with
containers inside the pod. The address assigned to the ceth1 interface is
unique across all infrapods in a testbed facility. Each ceth1 interface has a
corresponding svcX interface in the host network namespace (commonly referred
to as the init namespace). Here X gets assigned the integer id of the
materialization that is created by the Cogs. The ceth1 and svcX interfaces
are virtual Ethernet pair devices, or simply veth devices. Veth devices are
commonly used to plumb communications in and out of network namespaces. They are
very simple, any Ethernet frame that ingresses on one peer is forwarded to the
other.
On the 'bottom half' of the infrapods, is the infranet. Here we have a ceth0
and ifrX Ethernet pair. In this case the address assigned to ceth0 is not
unique across materializations. In fact it is almost always 172.30.0.1 as this
is the default infranet gateway for experiments. This overlapping is possible
due to the network namespaces and the fact that each ifrX interface is
enslaved to a dedicated bridge mzbrX.
On the other side of the mzbrX bridge is a VXLAN tunnel endpoint (VTEP). This
interface provides connectivity to the infranet of the experiment encapsulated
inside of a VXLAN tunnel. The routing and forwarding configuration of this
device is managed by GoBGP and
Gobble. More details on how the infranet is constructed and managed
is in the infranet section.
Nex
The Nex infrapod container provides
DHCP/DNS services for the resources in an experiment. There are a few networks
defined for each experiment. There is a command line client called nex that is
installed by default on the Cogs hosts. This client can be used to inspect the
state of DHCP/DNS networks operating inside infrapods, and even modify them in a
pinch.
In order to talk to a Nex instance running inside an infrapd, the service
address of the pod must be used. This can be seen using the cog show mz
command.
The address displayed above can be used to look at the Nex DHCP/DNS networks
These networks can be further inspected using the nex tool
and their members inspected
The above are the infranet address leases of the nodes in this 2 node experiment.
The above are static names and addresses associated with infrastructure services provided on the experiment infranet, hence the name static.
All of this information is populated by the Cogs when a materialization is first created. The materialization fragments that come from the merge portal are turned into Cog tasks by the driver that contain Nex configuration information that is extracted from the materialization fragments. This data is loaded into the Nex database using the service address of the infrapod and the Nex gRPC management interface.
tip
If you are just interested in seeing the node lease information about a
materialization, you do not need to go through this song and dance every time,
the cog show mz does this for you automatically and will show you the address
and lease time of every node in the experiment.
Foundry
The Foundry infrapod container
provides node configuration services for resources in an experiment. The system
images that the testbed stamps onto resources at materialization time contain a
daemon that runs at boot time. This is the Foundry client (foundryc). When the
Foundry client starts, it reaches out to the Foundry server (foundryd) at the
DNS name foundry which is resolved by the Nex DNS server pod described in the
previous section, requesting how it should configure the node.
Foundryd responds to foundryc requests with information including at a minimum.
- How network interfaces should be set up.
- User account information including SSH credentials.
- How routing should be set up.
- What the hostname of the node should be.
Foundryd is made aware of this information by the Cogs. When a materialization is created, the materialization fragments that come from the merge portal are turned into Cog tasks by the driver that contain Foundry configuration information that is extracted from the materialization fragments. This data is loaded into the Foundry database using the service address of the infrapod and the foundryd gRPC management interface.
Foundry information can be inspected using the Foundry command line tool that is installed as a part of the Cogs software.
This shows the full foundry configuration for both of the nodes in this two node experiment.
Sled API
Sled is one of the core components for experiment imaging. There are 3 major components to sled: client, daemon, and api. The sled client (sledc) is responsible for putting an image on a device, the sled daemon (sledd) is responsible for managing communications between the client and the api, and the sled api (sledapi) is responsible for managing etcd storage. The sled controller (sledctl) is an auxilliary tool for users to manage etcd.
Sledapi is created in the infrapod container for the harbor materialization. Its placement in the harbor materialization is necessary to communicate with the sled daemon, clients, which live in the harbor materialization until they can be moved into an experimentor's materialization.
At the core of the sledapi is the concept of a sled command (sledcmd). The sledcmd is the playbook for what actions a client should take when it runs sled. The 4 actions a client can take are:
- wipe: the wipe action indicates that the client should wipe (zero) the disk(s). This is an expensive operation, and should be done on teardown if used rather than on boot.
- write: the write action writes out a kernel, initramfs, and disk on the client. The kernel and initramfs are artifacts of the disk image, and are generated by the images repository. The kernel and initramfs are written to tmpfs, and cannot exceed the size of memory. The disk image is written to the target block device.
- kexec: the kexec action does a kernel execute from the currently running client (sledc on u-root) into the target kernel that was provided in the write action step.
- daemon: the daemon action tells the client to go into daemon mode and to wait until a future actionable command is given.
The sledcmd is stored in etcd given by a mac address key as shown below using
the sledctl command. The -S option below is the server ip address of sledapi
in the harbor materialization network.
The sledcmd has multiple fields:
- mac: mac address of the command.
- id: unique identifier of the command, so that we can query on the status. This id will change with every update to the command set, as each update creates a new command.
- time: the last time the command was updated.
- wipe: the wipe command contents.
- write: the write command contents.
- kexec: the kexec command contents. The kexec status will never be complete, as it is impossible to update the kexec field upon completion as the client will have already executed the new kernel and operating system.
The sledcmd information is passed to sledapi through the Cogs. On a dematerialization request, the cogs inserts a default image write action and daemon action into the sledcmd field. This tells the sledc to remain in daemon mode until it receives a new command. It also reduces the boot time if the experimentor uses the default image. On materialization, the Cogs inserts new fields, mainly a kexec action, and a write action if the default image is not used.
Moactld
The Moactld infrapod provides a means for the end-user moacmd (which runs in
a XDC) to control the network emulation provided by
Moa. Configuration is
automatically done by the Cogs via the API. It's primary function is to limit
access to the emulation that is part of the materialization to which a XDC is
attached.
Etcd
Etcd is the primary database use used by a Merge testbed facility. There are several systems that use the same underlying etcd cluster. Namespaced etcd proxies are used to isolate these systems from each other.
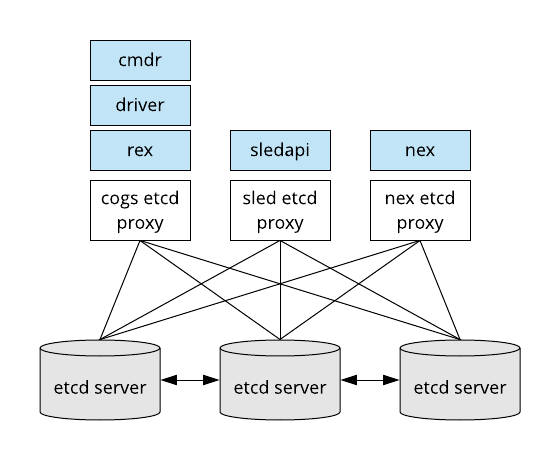
The proxies are local to the services that access them. So for example, in a deployment where rex and driver one server and the commander runs on another, both servers would run a copy of the cogs grpc proxy service. The etcd proxies run as systemd services. You can see them through the basic systemd service management commands.
These proxies are all configured to point at the etcd cluster running on the storage nodes inside the testbed facility. There are always an odd number of etcd servers in a cluster. Typically, etcd clusters are of size 1 or 3.
The proxy service configuration for the cogs proxy is located at
/etc/systemd/system/cogs-proxy.service, it's definition is useful to point out
a few things about the way in which etcd is deployed in a Merge testbed facility
- certificates are held in
/etc/etcd - Merge at times can use messages that exceed the default etcd threshold, so limits may need tweaking depending on the expected size of experiments.
- Proxy services listen locally on
2399for the cogs. Consult the other services for their ports. - Proxies act as a TLS boundary, e.g. the actual etcd servers require client authentication, but since the proxies only listen locally they do not. This simplifies service and operations staff interaction models with the etcd system.
Sled
The Sled is one of the core components for experiment imaging. There are 3 major components to sled: client, daemon, and api. The sled client (sledc) is responsible for putting an image on a device, the sled daemon (sledd) is responsible for managing communications between the client and the api, and the sled api (sledapi) is responsible for managing etcd storage. The sled controller (sledctl) is an auxilliary tool for users to manage etcd.
Where each sled component runs:
- sledc runs on the experiment device.
- sledd container runs on the storage server.
- sledd-nginx container runs on the storage server (hosts images).
- sledapi container runs in the harbor infrapod.
Discussion of sledapi in the harbor infrapod can be found earlier in the document under Sled API. This section will mainly cover the sled protocol and management from an operational perspective.
Sled begins with a node booting. The node is configured with pxeboot as the primary boot option, and disk booting as the next option, followed by EFI or another recovery boot option in case of failures. The secondary boot option using a disk, means that when a node is in a materialization it will not boot from PXE, but instead use the disk image which was written during the initial sled process. This provides users with the expected outcome of rebooting with the same disk.
Going back to the primary boot source using PXE. When the node initially PXE boots, the dhcp service which is handled by nex, maintains an entry for the pxe server and file. The node does a chain boot into this image which is actually an iPXE image (handled by the tftp container in the harbor network) that contains pointers to the sled-server and the sledc kernel and initramfs. sled-server here is the DNS name which is also stored in nex and points to the sled image mount server.
When the node boots, it boots into a u-root client, and runs an initial dhcp
request to retrieve an ip address. From there, it runs the sled client (sledc)
and it requests the sled command (covered in the sled api section). The client
uses every interface to request the sled command, and selects the first
interface which can resolve sled-server name. The request is then sent to
sled-server where the sled daemon (sledd) is running. Sledd then requests
from sledapi the command associated with the mac address. Sledd is also
responsible for handling the image copying process on the sled-server host
back to the client (over http).
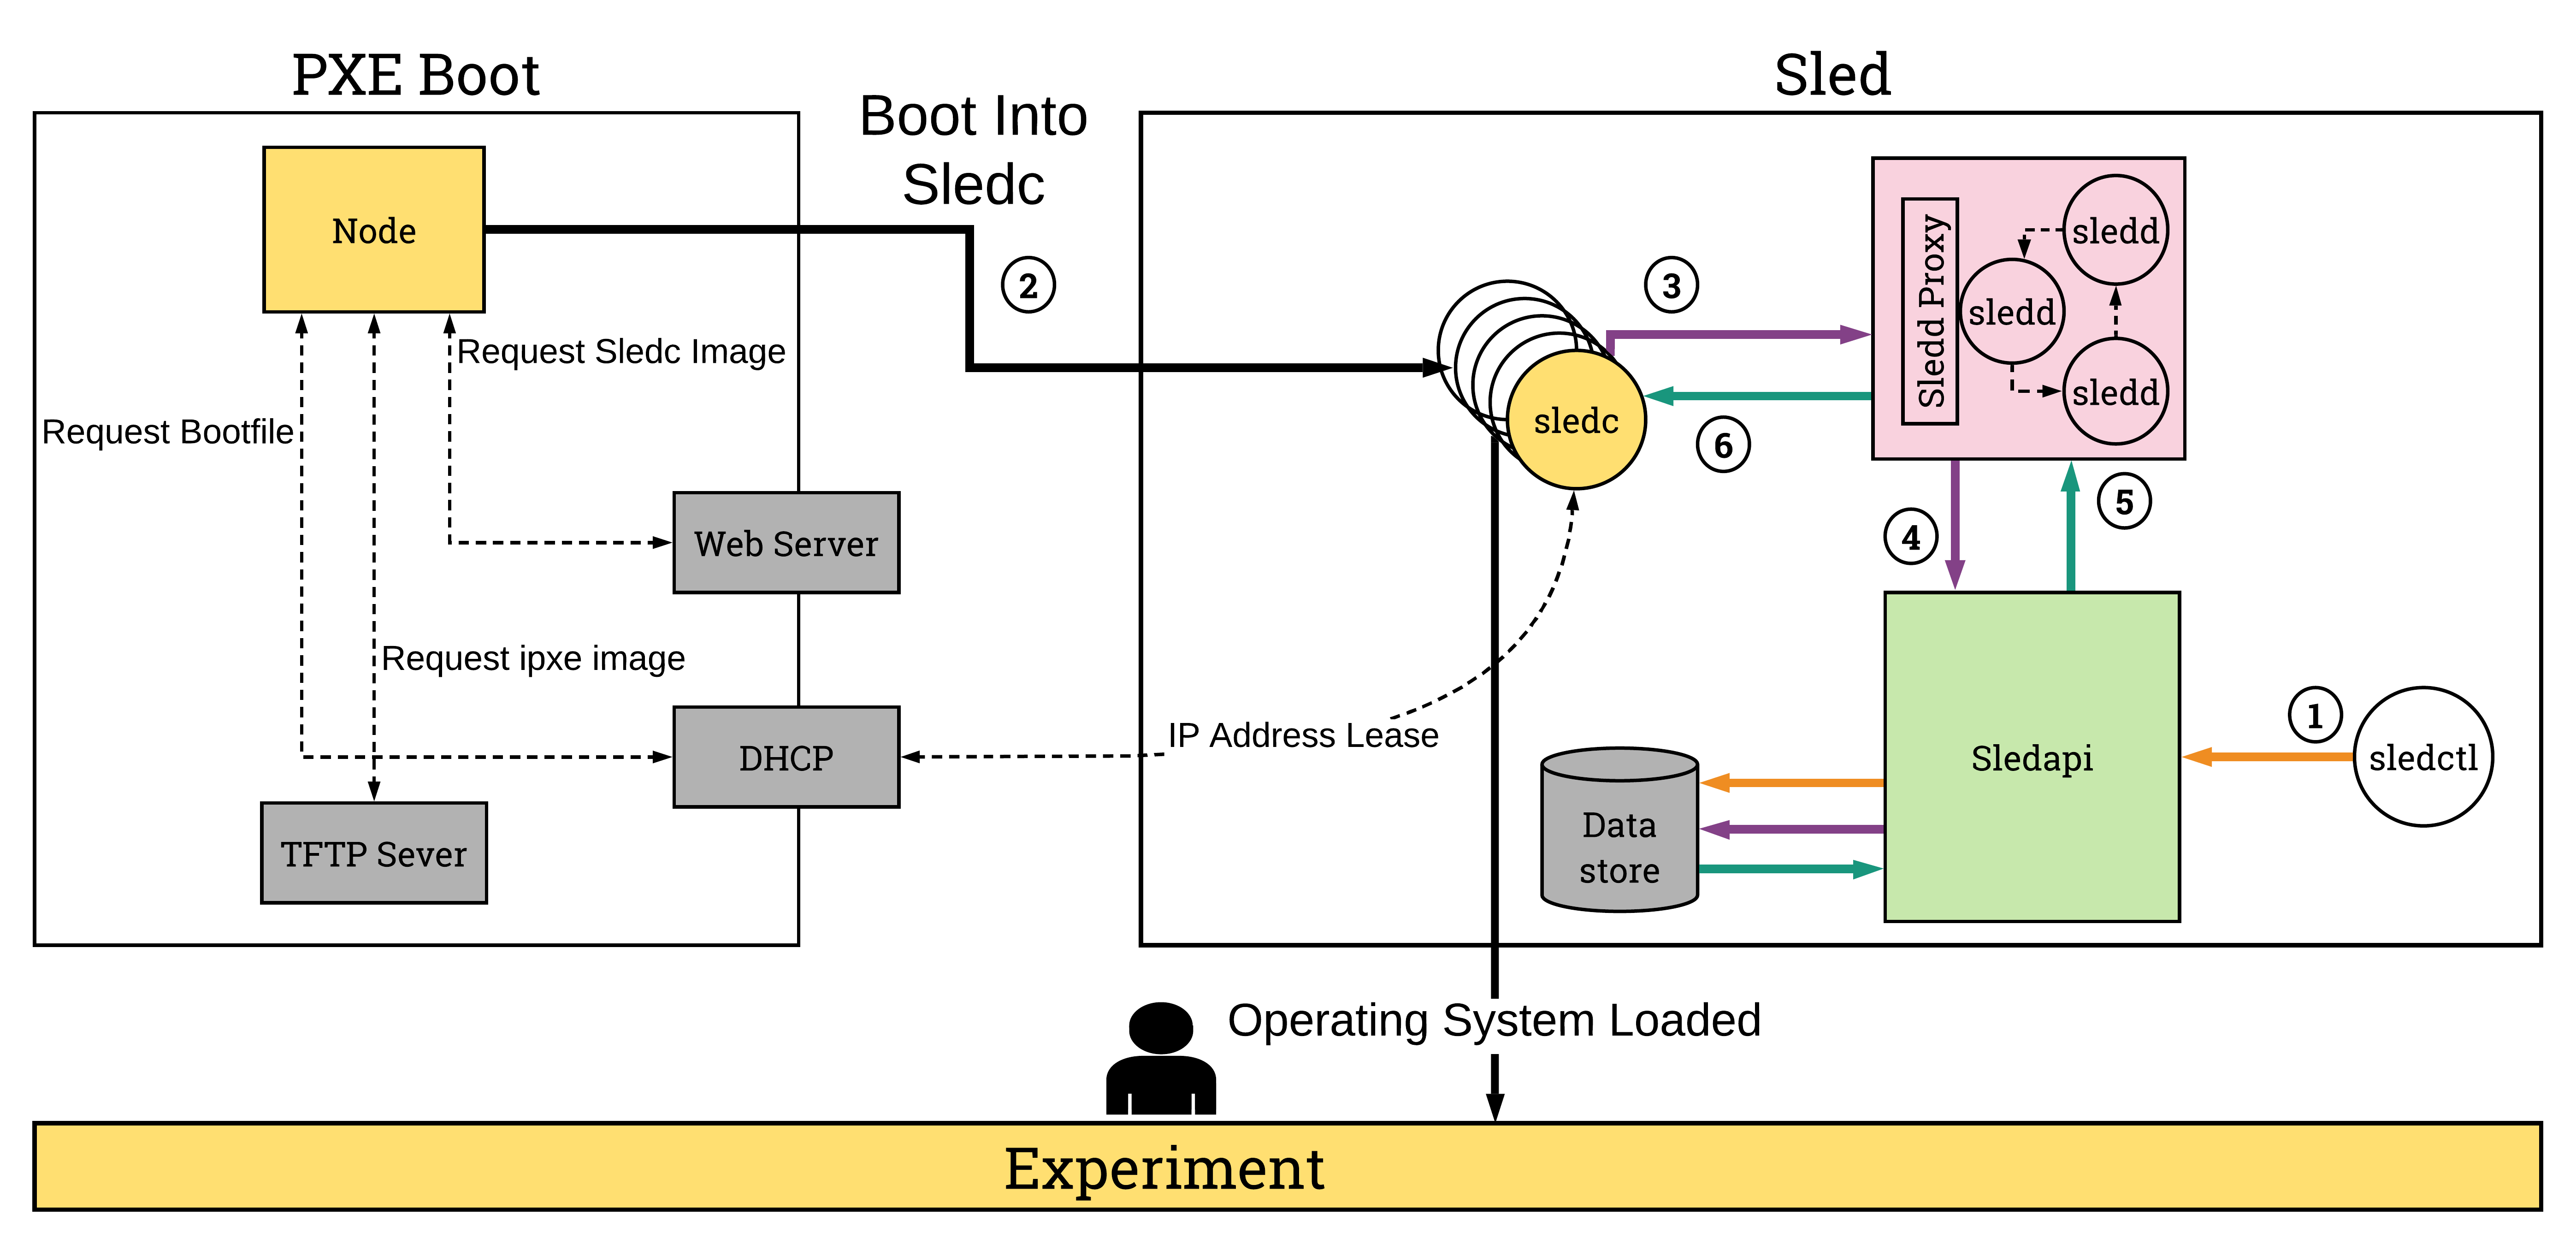
From the Cogs perspective, an MzFragment will come down to the driver with NodeSetup requests. For each node in the NodeSetup, a sled entry is created based on the mac address. The sled code managed by rex will check to see if the node is in daemon mode (ready for new commands), if so, it updates the sled command and sends it to the client. If not, it will create a full sled command that includes a write request as well, then restarts the node. The rex sled code will then wait until the node is reachable before returning. If the the node does not become reachable within a timeout timeframe, the task is failed.
Wgd
TODO
@geoff
Rally
Rally is the mass storage provider for experiment nodes. Rally is responsible for creating, managing, and removing user's experimental storage. Unlike mergefs which lives on the portal, rally is used for ephemeral storage, which lives either until the lifetime of the site, project, or experiment. Rally can run on one or more of the storage servers. Rally is made up of a single service rallyd and the controller tool rallyctl for accessing and modifying rally data.
Rally uses a default configuration file:
Rally depends on 2 other services: etcd and ceph. Additionally, most of the rally configuration file is defining ceph attributes. The root and users files dictate the cephfs path base off the root rally mount (/mnt/rally/rally/users).
There are two types of supported storage methods at the moment: site and experiment storage. Site storage is created through the mergetb cli and creates an AssetFragment, while experiment storage is created by experiment xir and generates an MzFragment.
Block storage is currently implemented, but has not been enabled in foundry configuration for auto mounting block storage.
The last asset, newAsset was created in the experiment xir definition, when
the portal looked up each asset and could not find newAsset, so it added it
to the experiment definition to have the site create an asset with the lifetime
of the experiment.
Rally is responsible for experiment storage, for now that is only ceph. For this next bit we will dive more in-depth into ceph. Ceph is installed by ceph-deploy. The main components of ceph are:
- Monitor (mon): manages the ceph cluster, creates quorum with other monitors. Monitors are the brains of the ceph cluster.
- Metadata Server (mds): manages the data distribution of ceph filesystem.
- Rados Gateway (rgw): interface for librados.
- **Object Store Device (osd): storage devices to hold ceph data.
- Ceph Manager (mgr): manages telemetrics of ceph (prometheus, alerts, etc).
Data placement over the OSDs is managed by CRUSH, an algorithm that attempts to reduce erasures by data encoding and data placement beyond failure domains. Data is stored in pools, based on the number of OSDs, the placement group value distributes the pools across OSDs.
In order for experimentors to mount the ceph filesystem, they need to know where the monitor is located, and the path to their data. Rally does this by maintaining a permissions map on each rally user, which maps 1-to-1 with a ceph user. The permissions are tied into the ceph secret, which prevents other users from accessing the data. An administrator can access this data through the rallyctl tool.
During the materialization of nodes, the Cogs make gRPC calls to rally to get this information and place it into the foundry data structure so when the node boots, the data is placed into the node's /etc/fstab to automatically mount the filesystem.
Moa
Moa is a daemon that
configures the network emulation, currently implemented using
(Fastclick)[https://github.com/mergetb/fastclick]. Moa is configured by the
Cogs via its API, and stores the mapping from user-specific tags in the network
model to the network links. It receives commands via Moactld, and utilizes
Fastclick's control socket interface to dynamically alter the network link
characteristics as requested.
The moactl CLI application can be used to inspect the emulations. It can be
installed via apt install moactl on the emulation servers. It has facilities
for listing emulations, showing the details of a specific emulation, and
starting or stoping the fastclick processes that perform the actual
emulation.
Beluga
Beluga is a power control daemon. It has the capability to control the power state of many different types of devices through a pluggable device framework. The way that Beluga works is that it exposes a generic power control interface for users of the Beluga API to control devices through. The Beluga power control daemon has a configuration file that maps device names to their underlying power control model. When Beluga receives power control commands it looks up the power control protocol for the device it received the command for and translates the Beluga command into the power control protocol for that device.
An example Beluga configuration looks like this.
Here we see the configuration space partitioned into two categories, the device parameters and the power controller parameters. The device parameters make devices controllable through the Beluga API and link each device to a set of control parameters. The control parameters tell Beluga how to interact with the power controller for the specified device.
Beluga runs as a systemd service
and is available through apt packages
GoBGP
GoBGP is a border gateway protocol (BGP) daemon that runs on all testbed servers that provide services directly to testbed nodes over the infranet or xpnet. GoBGP implements the BGP protocol and provides a gRPC interface for programmatic control. The way these networks are put together through protocols like BGP will be explained in more detail in the infranet and xpnet sections. Here we will simply go over the mechanics of GoBGP operations.
GoBGP runs as a systemd service
You'll find GoBGP running on
- Infrapod host servers
- Sled imaging servers
- Moa emulation servers
GoBGP also comes with a command line tool.
Peers
The neighbor command shows us information about who we are directly peered with.
This tells us that the daemon on this node has been up for 31 days, and has received 1904 routes from peers.
Underlay Routes
The global routing information base shows us what underlay addresses are routable from our current location. The underlay network provides the foundation over which a set of overlay networks may be created.
You should be able to ping any addresses if Gobble is running and has provisioned the corresponding routes.
Overlay Routes
The global routing information base for Ethernet virtual private network (EVPN) show us what overlay addresses are routeable from our current location. The overlay network provides an isolated communication substrate for materialization networks that do not interact with other experiment networks or testbed infrastructure networks.
On an active testbed there will be a lot of EVPN overlay routes, thousands or tens of thousands depending on the size of the testbed facility. EVPN routes come in two flavors
- Type-2 (macadv): These routes define layer-2 segments by providing reachability information for MAC addresses across the overlay within the context of a virtual network identifier (VNI). A VNI is an integer value that defines the isolation domain of the route. This is what provides separation between segments. So if the VNI on one advertisement is 100 and 101 on another, the destinations will not be able to communicate.
- Type-3 (multicast): These routes define layer-3 reachability information in terms of underlay addresses. It's a way of saying that for a given VNI, there are targets of interest at the specified underlay address. This serves the function of routing broadcast, multicast and unknown (BUM) packets. When a packet is a BUM packet, it will be broadcast to all Type-3 destinations within the VNI context.
Installation
GoBGP is installed by installing Gobble.
Configuratoin
The following is an example of a GoBGP configuration located at /etc/gobgp.yml
Gobble
GoBGP speaks a variety BGP dialects and, provides a gRPC API and command line client to inspect and manipulate the routing and forwarding space for a variety of BGP based protocols. What it does not do is create any routing or forwarding tables on the machine it is running on. This is what Gobble does. Gobble uses the GoBGP gRPC API to inspect the reachable EVPN overlay routes of the node it is running on and updates the underlying Linux routing and forwarding tables accordingly.
Gobble runs as a systemd service
Installation
Configuration
The gobble configuration file is located at /etc/gobble.yml
Canopy
Canopy is a framework for creating virtual networks. There are 3 main parts
- A client that lets you efficiently manage virtual networks across a switching mesh.
- A daemon that runs on switches and servers that implements virtual network synthesis commands received by clients.
- An API and library for programmatically managing virtual networks.
Inspecting Virtual Networks
Using the Canopy client you can inspect the state of any switch or server in the testbed that is running the Canopy daemon. Platforms in a Merge testbed that run the Canopy daemon are.
- All switches
- Infrapod servers
- Storage servers
- Network emulation servers
- Physics simulation servers.
The network state of a host can be inspected with canopy as follows.
This output shows us the physical interfaces, VXLAN tunnel endpoints, bridges and their state. This display does not show it, but the interfaces are also colored green if they are up and red if they are down.
Managing Virtual Networks
The Canopy client also lets you modify virtual network state. For example, for
the above server isp0, if we wanted to add the VLAN tags 47 and 99 to interfaces
if0, if1 and if3, we could do the following.
This is the general structure of most commands. Where we have a command stanza, a set of parameter values, a set of ports to apply those values to and a set of hosts to apply the commands to. In the above example we only had one host target, however we can even extend the command to multiple switches.
Internally the components use the Canopy API to create virtual networks for experiments in an automated way.
The Canopy Daemon
In order for the Canopy client CLI or library to be able to setup networks on devices, the Canopy daemon must be running on those devices. The Canopy daemon runs as a systemd service
There is no configuration for Canopy, it just needs to be installed and run. It uses the Linux netlink socket to get all the information it needs and to implement the command requests it receives.
At the time of writing canopy configurations are not persistent. So if the host is rebooted, the configuration will be lost, and the host will need to be re-configured.
Installation
Client
Server
Node Booting Imaging, Initialization, & Debugging
When a node is not in use on the testbed, it is in a special virtual network called the harbor. When a node is selected for materialization the following things happen.
Booting
When a node first boots on the testbed, its firmware must be configured to PXE boot. This is so the testbed can take control of the node. All nodes that are not in use are on a special virtual network called the harbor. There is a DHCP server running on the harbor that provides BOOTP protocol information to PXE clients sufficient to load a bootstrapping PXE or UEFI image from a TFTP server on the harbor.
Both the DHCP server and the TFTP server run as containers in the harbors infrapod.
note
The name of the harbor is main.harbor.<testbed-name>
You can see the BOOTP protocol options by inspecting the networks of the dhcp server.
This shows that we have two distinct harbor networks. One main network that serves EFI firmware on boot, and one bios network that serves legacy BIOS firmware on boot. The static network is for providing DNS resolution for service addresses such as foundry.
We can inspect the DHCP/BOOTP configuration of the main harbor network as follows.
This shows us that the EFI image PXE clients will be directed to is called
pxe.efi.
To see exactly which nodes will be picked up on this network, we need to look at the network membership.
This list shows that membership for this network is based on fixed MAC address mappings. Other mapping mechanisms are available. On testbeds that only have a single type of firmware, a Nex network that picks up all nodes may be defined. Nex also allows for MAC ranges to be specified, so devices can be targetd by OUI.
The TFTP server container is pre-loaded with 4 basic bootloaders by the testbed software. These bootloaders are built from the MergeTB fork of the iPXE firmware
pxe.efi: EFI bootloader that will attempt to use all interfaces it can find.pxe.bios: BIOS bootloader that will attempt to use all interfaces it can find.snponly.efi: EFI bootloader that will only use the network interface it was chain loaded from.snponly.bios: BIOS bootloader that will only use the network interface it was chain loaded from.
The sole task of this bootloader, in whatever form it comes in, is to load the Sled imaging kernel. The Sled imaging kernel is a lightweight Linux OS that loads purely into the memory of the machine and performs OS imagaing operations.
Imaging
When Sled boots on the node, it attempts contacts the sled server running in the harbor asking for instructions. At this point, if the node is undergoing a materialization, the sled server will send back a message telling the sled imaging client what image to pull down. The sled client will download the specified image and write it to the disk specified by the sled server.
The Sled client also downloads the kernel for the specified OS separately, and then kexecs directly into that kernel. This saves a reboot cycle - which can be a very costly operation, especially on server grade hardware.
Sled is also responsible for providing sufficient kernel parameters for the node to boot. These parameters are a part of the testbed model, and the testbed automation systems that configure the nodes for booting provide this information to Sled from the testbed model. This includes
Root file system location
Merge OS images use the GPT partitioning scheme. By default Merge images have
the boot partition at the partition UUID (PARTUUID). Note that this is a
partition level label and not a filesystem level label.
serial console settings
Serial console settings are necessary to ensure that once the node boots, it's output is available via the serial console. This is a critical lifeline when the network connection on a node goes sideways. An example is as follows
if you have hardware that sometimes has issues booting, using the kernel earlyprintk option can be very helpful
Bootstrap network interface
When a node boots, it needs to know how to bootstrap the network. This is
provided to the node configuration system by a kernel parameter called
infranet.
Experiment Images
Experiment images are created using the images repo. Currently images are generated using packer. Packer takes in an image definition in the form of a json template and outputs an image as defined by the template. In the case of merge and sled, these images are output as raw images, which sled will then write directly to the block device.
There are 3 outputs of the packer build process that merge requires:
- Disk image
- Kernel
- Initramfs
The disk image is generated from the template itself. The kernel and Initramfs
are created by scripts in the image repo that extract the kernel and initramfs.
In most operating systems, there are multiple kernels and initramfs, so one
script will create a symlink with a sled- prefix that maps to the currently
used version. As the prefix denotes, this is used by sled during the kernel
execution (Kexec) into the operating system.
Currently experiment images are segmented by the operating system and the firmware (bios, efi). This is important as above we discussed the root file system partition, it is the image that is responsible for creating this filesystem, and the firmware and bootloaders also need to know about the partitions that are created. For example, in an EFI based system we need to identify the EFI partition.
This enables the images to survive reboot. While the initial boot is done from a kexec, additional boots are done through standard grub bootloading.
Experimental images are rarely updated, but when they are they generally fall into 3 categories of updates:
- Operating System update (upgrade version)
- Operating System packaging/tools (add prerequesite pacakge)
- Mergetb packaging (foundryc, retty)
Updating Testbed images
There are three types of images used during the mergetb imaging process:
- PXE Image
- Sled Image
- Experiment Image
We've previously discussed each of these images in sections above. To provide a brief recap, pxe images are used to chainload into the sled image, the sled image boots into the experiment image, and the experiment image is used by experimenters. We will dive into a few more specifics for each topic to address how to update a testbed image.
Updating PXE Images
The pxe images live on the infrapod host and are mounted by the tftp container.
The below exerpt shows the specifications for the harbor as was shown above,
particularly the mounting source and destination. The tftp container is hard
coded to mount from /srv, but the source location is left to the facility
administrator.
When updating a pxe image, the location to place the updated images depends on the source value. It is common to need to spin out a new pxe image due to new physical hardware and the specifications of the console settings or additional linux kernel parameters necessary for sled to work.
After building the pxe image the
destination is based off of the firmware (bios or efi), and how the nex
networks were configured. Recall in the booting section we discuss how nex plays
a role in how images PXE. So the names used should match those in the nex
entries which are being mounted by the tftp container.
Updating Sled Images
Sled images mainly consist of the u-root binary with sledc built on top. Sled is the imaging protocol, and will likely get updated for a variety of reasons: u-root version, kernel packages, sled protocol change, or boot process.
Noted in the section above in the ipxe section, is the destination of the sled
image (http://sled-server/pxe). So this again depends on nex dns resolution
and the webserver running on that host. In most testbeds, this webserver will
be the slednginx
container. The code that specifies the destination for where images live is
here.
So for slednginx, the destination is hardcoded as /var/img on the
sled-server host for experiment images, and /var/img/pxe for these sledc
images. The directory pxe here is a reference that these images are loaded
by pxe, not that they are ipxe images as described in the section immediately
above.
Updating Experiment Images
Testbed experiment images are serviced by sled. The location of those images
is also based on the webserver servicing http requests (default /var/img).
However, the sled protocol is actually relying on the value given by the sled
command:
Within the write command, the names of each entity: image, kernel, initrd is
both a filename and a path. So sledc will generate an http get request for
http://sled-server/ubuntu-1804-disk. So based on how the root directory
of the webserver is hosted, and what the image name is determined to be in
etcd for sled, will determine the location and name of the experiment image.
Recommendations for updating images
There are several recommendations to make when updating any of the above images on the testbed.
- Prior to deployment on the physical testbed, attempt to verify that the image works under similar conditions in a staged virtual environment.
- Disable materialization to the site via the Merge API prior to copying the images over. The testbed is a dynamic system, during an image update a materialization may cause an incomplete image to be copied.
- Update sled images for sled daemons. Sled clients in daemon mode act as a cache of images, when a node dematerializes, the cogs place the node into daemon mode and download the default images. When an images are copied over to the new location, if the default image is changed or the sled client itself is changed, all nodes in daemon mode are running the old cached version. For testbed images, one can either update the sled daemon entries with the latest version (a write to the etcd key will cause an update to occur). For sled client images, one can either reboot the node, or use the Sledc Upgrade command to kexec into the new sledc image.
Configuration
At this point the user specified OS is booting. All MergeTB compatible images run a node configuration daemon on startup.
Debugging
This section covers a few more of the specifics with regards to how sled interacts with the cogs, and where problems tend to arise, and how to solve them.
The most common issue that comes up is when the cogs displays: failed to daemon node as shown below.
This task is the most common failure because it is primarily responsible for imaging a testbed node and has the largest vector for errors. The first step to take in debugging these nodes is to grab a console session to the node, and delete the task error and watch for what happens.
The most common failures are:
- PXE DHCP Failure
- This leaves the node to follow the boot order, which with an unsuccessful PXE will result in the last operating system installed to the disk.
- DNS Resolution Failure or Sledd/Networking
- If
sled-serverfails to resolve, orsleddis unable to complete the transaction, the node will end up inu-rootwith a>elvish shell. Onsledcnodes the logs can be found at/tmp/sled.logand the database/tmp/sled.db. You can read these files to get more details.
- If
- Latency
- It is common when there are hundreds to thousands of nodes rebooting that a node may not download the images on time. In this case you will also find the node in
u-root.
- It is common when there are hundreds to thousands of nodes rebooting that a node may not download the images on time. In this case you will also find the node in
If the console is not working, sledctl has a builtin command line interface which can be used to interface with nodes which have made it to sledc.
sledctl ping is a daemon command for checking if a sled node is listening. This is used directly by the cogs to check if a node is already configured. sledctl run allows for remote command execution on the daemon node.
Infranets
The infranet is a flat network that interconnects every node in an experiment. There is one infranet per experiment. The infranet serves the following basic functions.
- Provides access to experiment resources through XDC wireguard connections.
- Allows every experiment node to reach every other node for the purposes of experiment automation.
- Provides external network access to nodes, most commoly the Internet.
- Provides mass storage access to experiment nodes.
- Provides DHCP/DNS to experiment nodes.
- Hosts a materialization-specific node configuration server.
- Hosts a API endpoints for emulated network control and physics simulation control.
When an experiment is materialized the following things happen to construct the infranet for that experiment.
Infrapod Network Enclave
The first step in establishing an infranet is creating a network elclave for the infrapod. As a reminder an infrapod is a set of containers that share a common network namespace that collectively provide the basic infrastructure for an individual experiment materialization.
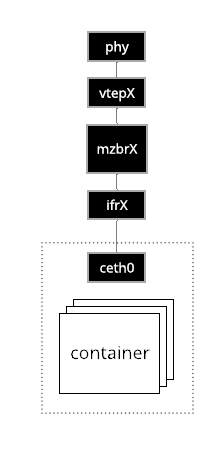
The network enclave for an infrapod contains the network elements that allow it co communicate with the nodes in an experiment. This includes
Virtual Ethernet Pair
A pair of virtual ethernet devices strattle the network namespace that
encapsulates the containers of the infrapod and the default (sometimes called
init) namespace of the host. The veth device internal to the namespace is always
named ceth0. The veth device in the default namespace is named ifrX where
X is the integer ID of the materialization.
Materialization Bridge
The materialization bridge, called mzbrX where X is the integer ID of the
materialization, connects the extenal veth device to a VTEP device. This bridges
the infrapod's namespaced network elements with the infranet of the
materialization through the VTEP.
Vtep
The VTEP, called vtepX where X is the integer ID of the materialization, provides
access to the experiment infranet that spans the testbed switching mesh through a
VXLAN tunnel and a set of routes and forwarding entires through that tunnel.
Infranet Virtual Network
The infranet exists as a virtual network that spans the switching mesh of a testbed facility. Depending on the design of the testbed, this may be a pure VXLAN virtual network or may be a combination VXLAN/VLAN virtual network. In the example that follows we present a combined VXLAN/VLAN implementation.
Consider the infranet depicted in the following diagram.
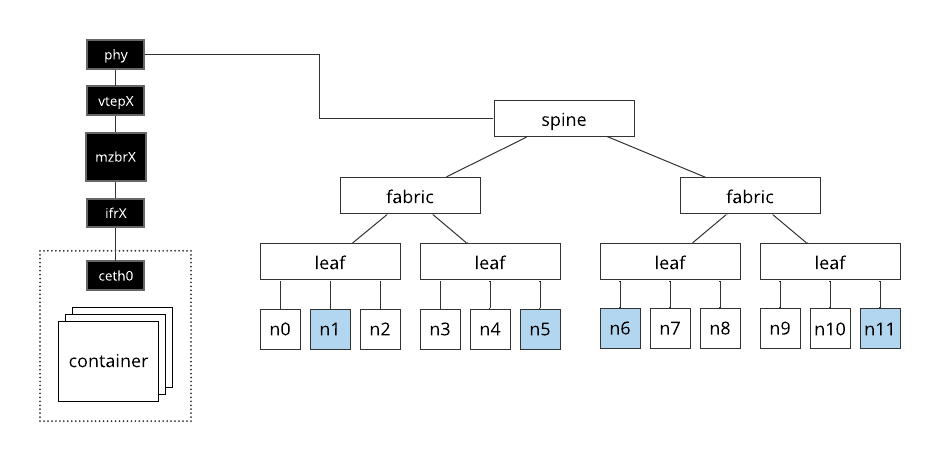
Here, the nodes shaded in blue are the members of the materialization. For Merge testbed facilities, we typically refer to switches in 3 categories.
- Leaf switches: Provide only VLAN based access to testbed virtual networks.
- Fabric switches: Provide VXLAN (and possibly VLAN) based access to testbed virtual networks.
- Spine switches: Interconnect fabric switches and are pure underlay e.g., they transit VXLAN encapsulated traffic but do not take part in encap/decap themselves or actively particiapte in VXLAN control plane protocols such as EVPN.
In this example the infrapod has a VTEP whose parent interface is the physical interface of the infrapod server that connects directly to a spine switch. The nodes that the infrapod must communicate with are below leaf switches. The way this all comes together is the following.
- The testbed automation system creates VLAN access ports for each of the nodes on the infranet.
- A VLAN trunk is created on the uplink of each trunk switch and the corresponding dowlink of each fabric.
- A VTEP is created on each fabric switch, attached to the bridge of that switch and given the same VLAN access tag as the fabric downlink in (2). This funnels all traffic from the node into this VTEP.
- The switch is configured to advertise the virtual network identifier (VNI) of every VTEP that is created on it, so all peer routers are aware of it's existance.
- The GoBGP router running on the infrapod host sees the advertisements from the fabric switches saves them to it's local routing information base (RIB).
- The Gobble daemon running on the infrapod host sees the new advertisements in
the RIB based on periodic polling (once a second by default) and adds
corresponding routing and forwarding entries to the server it is running on
so that the corresponding nodes are reachable through it's local
vtepXinterface. - The testbed automation sytem creates an EVPN advertisement for the internal
infrapod interface
ceth0. All of the fabric nodes in the testbed see this advertisement and create the corresponding routes through the VTEPs that were created on the VNI specified in the advertisement. - At this point bidirectional communication has been established between the nodes, and between the nodes and the infrapod.
Inspecting the infranet from an infrapod server
We can see many elements of an infranet from an infrapod server. First let's
take a look at a materialization's metadata through the cog tool
This shows us that the VXLAN VNI associated with the infranet for this materialization is 100. We also see that the virtual network index of this experiment is 100. It's common for the VNI and vindex for an experiment to be the same number.
tip
Because the infranet is a flat network, there is always just a single VNI for each infranet
If we look at the network of the infrapod server hosting this infrapod we can see the following.
Likewise we can peer into the network namespace for this materialization
The EVPN/BGP state can be inpsected through the GoBGP tool. To see the underlay network.
This shows us the other routers that can be reached from this node. The node
that has the next hop of 0.0.0.0 is the node we are on. The other routers in
the network are the fabric switches in the switching mesh, stroage servers, and
other infrapod servers. The IPs associated with each of these routers are what
we refer to an tunnel-ips. This is because these are the tunnel entry points
for VXLAN networks. These VXLAN networks are laid over the top of these tunnel
entry points, and for that reason, the tunnel-ip network is called the
underlay network and the VXLAN network is called the overlay network.
We can also inspect the state of the overlay network. For any non-trival sized testbed, the overlay network can have a very large number of entries. Here we focus our attention to the entrires involving VNI 100 belonging to the materialization we are looking at.
Here we see two types of routes
- multicast: These routes determine how 3 classes of traffic broadcast, multicast, and unknown - collectively known as BUM are forwarded. All egress traffic that falls within the BUM class is sent to all routers for wich the originating router has a multicast advertisement on the VNI in question.
- macadv: These routes determine how traffic belonging to specific MAC addresses is forwarded. If switches are set to learn MACs as they cross VTEP boundaries, these MACs will be advertised to reduce uknown traffic that must go through multicast routes. The testbed automation systems will also pre-seed known MACs at their fabric entry entry points to prune the initial BUM tree.
We can see how these BGP/EVPN advertisements manifest as actual routes by inspecting the routing and forwarding state of the infrapod server.
Here we see the VXLAN forwarding entries for vtep100 on this host. The first
entry corresponds to the macadv entry from GoBGP above. The second entry
corresponds to the multicast entry from GoBGP above. The 00:00:00:00:00:00
entry is a special forwarding entry that says send all BUM traffic to the
following destination. The remaining two entries are plumbing for the vtep100
itself onto and off of the mzbr100 bridge.
Note that we do not see an explicit forwarding entry for the ee:f8:c9:77:d9:e0
macadv above. That is because this is the MAC address of the internal veth on
the infrapod we are looking at, so there need not be an external forwarding
entry.
All of the overlay traffic is handled at the forwarding layer. The underlay traffic is handled at the routing layer. We can see routes to the underlay addresses from earlier as follows.
By default, testbed managed routes on infrapod servers, storage servers, emulation servers and simualtion servers are kept in table 47 to keep them separate from the management routing table of the server.
All of the above routing entries and forwarding entries are maintained by a
daemon called gobble that runs as a systemd service. Gobble periodically polls
GoBGP for the underlay and overlay state of the network and adds/removes forwarding
and routing entries to the kernel as necessary.
note
Gobble will only add underlay routes for BGP peers with active EVPN routes, otherwise there is no purpose in talking to the peer and an underlay route is not added - even through the peer may have advertised its tunnel endpoint over BGP.
Inspecting the infranet from an fabric switch
The state of the infranet can also be inspected from fabric switches. The switches in a Merge testbed facility run Cumulus Linux, which uses Free Range Routing (FRR) as the routing protocol suite.
To inspect the underlay network from a fabric switch
Likewise we can inspect the EVPN status for VNI 100
As well as the BGP forwarding entries