Portal Overview
The Merge portal is a Kubernetes based experimentation hub for testbed users. The portal provides the following services to users
- Implements the Merge API that allows users to
- Manage projects and experiments.
- Manage experiment revisions.
- Compile and analyze experiments.
- Visualize Experiments.
- Realize Experiments
- Materialize Experiments
- Launch and access experiment development containers (XDC)
- Attach to experiment infrastructure networks from XDCs
- Store data in home and project volumes that are independent of individual experiment lifetime.
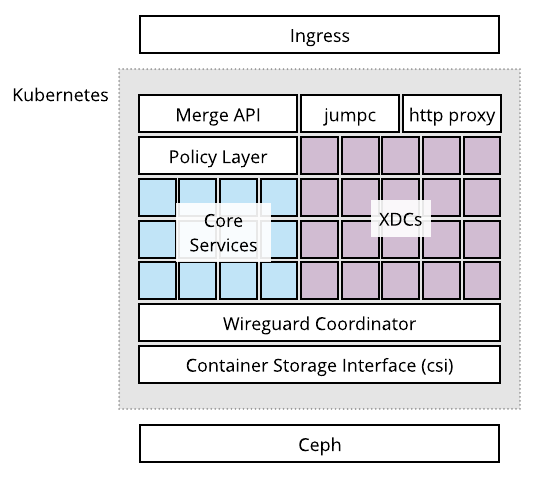
The Merge portal implements these features in a layered architecture which is depicted below.

The ingress layer is the front door of the portal. It is responsible for routing traffic from external sources to the correct internal destinations within Kubernetes. Inside Kubernetes, the Merge core services, including the Merge API, are hosted as pods. These pods collectively implement all the services described above. Beneath the pods are a connectivity layer that allows users to access their experiments on remote testbeds, and a storage layer that provides an interface between pods and a Ceph-based persistent data storage cluster.
Each of these layers is described in more detail below
Hardware
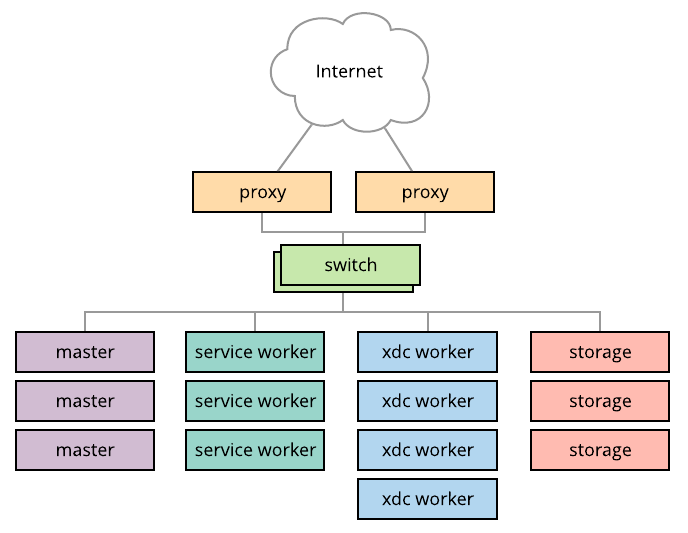
There are many different hardware arrangements that can comprise a Merge portal. A typical hardware deployment for a Merge portal includes.
- 1 or more proxy servers that implement the Merge ingress layer.
- 1 or more Kubernetes master servers
- 1 or more Kubernetes worker servers
- 1 or more Ceph storage servers
These servers can be physical or virtual. Virtual deployments allow for smaller portals to be built from a single server if needed.
There are several logical networks that interconnect the various portal systems. Typically these networks are partitioned into two physical networks:
- management network: allows for administrator access to nodes for maintenance, log aggregation and alerting.
- data network: provides connectivity between the core systems and services that implement the portal's functionality.
note
10 gbps or greater networks are recommended for the data network, as this network interconnect storage servers and carries remote mounts from storage servers to XDC worker nodes
A typical portal deployment is shown in the diagram below, with a pair of switches interconnecting every node onto the management and data networks.

Ingress
The portal ingress systems are designed to route traffic between external clients and the services provided by the portal. This routing is implemented by a set of proxy servers. Each proxy server:
- Runs an nftables based NAT that funnels external traffic aimed at specific API endpoints onto the correct internal network entry point.
- Runs an HAProxy proxy instance that load balances traffic across replicated internal services.
The are 4 public access endpoints exposed by the portal.
merge-api:443This is the TLS endpoint for the Merge API.xdc:2202This is the SSH endpoint for XDC access.xdc:443This is the TLS endpoint for XDC web interface access.launch:443This is the TLS endpoint for accessing the Merge 'Launch' web interface.
On a live Merge system, each of these endpoints is assigned a public IP address for user access. It is the job of the ingress layer to route traffic on these addresses to the corresponding internal subsystems.
NAT
The NAT rules that route traffic in and out of internal portal networks are actually quite simple. Consider the following example where the following IP address mappings apply.
| endpoint | IP |
|---|---|
| merge-api | 2.3.4.10 |
| xdc | 2.3.4.100 |
| launch | 2.3.4.200 |
Then the corresponding nft rules provide NAT into and out of the portal
internal networks.
These rules are automatically set up by the portal-deploy playbook. However the goal here is to describe how these rules work in the context of the larger Merge portal systems.
So great, the external traffic is are getting NAT'd to ..... various localhost addresses? Hang tight, this is where HAProxy takes over.
HAProxy
In the previous section, we described how external traffic directed at Merge
services is routed into and out of a local address space. Each one of the local
targets used by the nft NAT (127.0.1.[2,3,4]) is used a front-end address by
HAProxy. We refer to these local addresses as anchors.
The primary function HAProxy serves, is distributing traffic from anchors to their corresponding services in the Merge Kubernetes cluster. Consider the following HAProxy configuration fragment.
Here we see that HAProxy is binding to one of the anchors nft is NAT'ing
traffic to 127.0.1.2 on port 443. On the back side, HAProxy is distributing
this traffic to 3 backend servers mapi[0,1,2]. These host names are bound to
addresses that belong to Kubernetes external services that connect to the pods
that implement the Merge API. These host name bindings are placed in
/etc/hosts by
portal-deploy. By default
the mapping is the following.
| name | address |
|---|---|
| mapi0 | 10.100.0.10 |
| mapi1 | 10.100.0.11 |
| mapi2 | 10.100.0.12 |
However, these addresses are configurable, so the addresse mappings may vary between installations.
All of the other endpoints follow the same basic scheme. Using nft NAT onto
local addresses and HAProxy for distribution onto Kubernetes service addresses.
Kubernetes
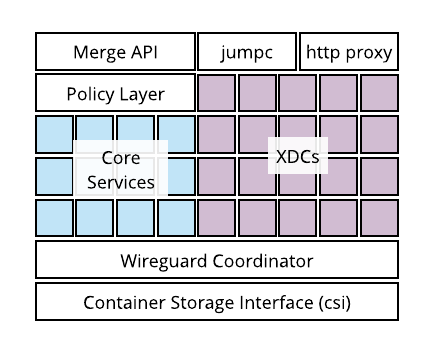
The bulk of the Merge portal lives inside Kubernetes. The Merge systems that live inside Kubernetes can be broadly partitioned into two mostly independent stacks.
- The Merge API, Policy Layer and Core Services
- XDCs, SSH Jump Bastions, HTTP Proxies

Each of these systems occupies a namespace in k8s. To get a sense of what's
running, you can use the kubectl get pods function in each namespace on one of
the k8s master servers in your deployment.
The Merge API and associated core services run in the default namespace.
By default each service is replicated 3 times.
The XDC systems run in the xdc namespace.
Here you'll see containers that users have created to work with their
experiments, as well as the jumpc and web-proxy infrastructure containers.
Merge API
The Merge OpenAPI 2 specification is implemented inside k8s by a pair deployment and service objects. The API pods are exposed to the HAProxy instance in the Ingress layer through external services.
We can see these services as follows.
The EXTERNAL-IP addresses should match the HAProxy backend targets described
in the ingress section. Services are a k8s abstraction that bind
addresses to a set of pods. This binding is done through selectors. We can see
the selectors using kubectl describe.
The Selector: app=portal,component=api tag means that traffic to this service
will route to any pod that the tags app=portal and component=api. Taking a
look at the API pod deployment we see that these selectors have been applied to
the API pods in the Pod Template section below.
Policy Layer
Every single call to the Merge API goes through the Policy layer. This is an authorization layer that happens after client authentication. The policy layer determines whether the caller is authorized to make the requested API call based on a declarative policy specification that is put into place by the portal administrator. The following is a concrete example of policy that governs experiments.
This policy states that an experiment is subject to one of three potential policy sets.
- public
- protected
- private
Each policy set lays out a set of rules that govern how users can interact with
experiments. For example in a public project any user can read the data
associated with an experiment, such as the topology definition. However, for a
protected project only project members can read experiment data and for a
private project only maintainers and creators can see an experiments data. A
complete policy rule set is defined
here.
The API pod expects to find the policy definition at the location
/etc/merge/policy.yml. The policy file is typically provisioned at this
location by an administrator through a k8s
configmap.
The portal-deploy will set
up the merge-config configmap automatically and reference it from the API
container. Operations engineers may reference
this playbook
for guidance on provisioning policy updates through configmaps.
Core Services
Once an API call has cleared the policy layer. The API service delegates the call to one of the Merge core service pods. These core service pods include
- alloc: manages resource allocations
- commission: handles adding/removing resources and resource activation state
- materialize: automates materializations of experiments across testbed facilities
- model: provides model compilation, static analysis and reticulation services
- realize: computes embeddings of user experiments onto underlying resource networks.
- workspace: provides experiment and project management services
By default, each of these core services has 3 replicas. The naming scheme of each service is as follows.
The logs for each service can be obtained by kubectl log. For example
Each Merge core service has a corresponding k8s service. This allows the API to talk to services by name, and in some cases for the services to talk to each other by name.
Container Images
By default the containers in the portal pull from the latest sources in the MergeTB Quay repository. The URI scheme for these containers is the following.
A quick way to see what images you are running is the following.
You can change the image a deployment points to by using kubectl edit. For
example to change the realization image.
This will drop you into an editor with a YAML file where you can search for
image: and you will find a reference to the current image that you can modify.
Upon saving the file and closing the editor, k8s will pick up the changes, bring
up a new replica set that points to the specified image and take down the old
replica set.
Etcd Database
The Merge Portal uses etcd as it's sole database. Etcd is hosted in a k8s deployment with an associated k8s service just like the Merge core services.
One significant difference with the etcd deployment, is that the underlying storage used for the database is provided by a Ceph mount through a combination of a persistent volume and a persistent volume claim.
These k8s storage elements can be seen through kubectl as follows.
For the volume
and for the claim
These volumes are mounted into the etcd container through the
etcd deployment definition
and can be viewed using kubectl describe
Launch Web Interface
TODO
@glawler
XDCs
Experiment development containers (XDC) provide a gateway to experiments for users. These are containers that are launched on-demand through the Merge API and are made accessible through
- SSH jump bastions
- HTTPS web proxies
XDCs and the infrastructure to support them are in the xdc namespace. The one
exception is the xdc-operator pod, which is in the default namespace. This pod
is responsible for launching XDCs using the k8s API and responds to requests to
spawn or terminate XDCs from the Merge API.
Each XDC has several persistent volume mount points.
- 1 for the home directory of each user
- 1 for the project directory of the parent project
These can be seen through the kubectl describe method.
Here we see that there are 7 home directories and a project directory mounted.
Each of these is mounted from the mergefs Ceph file system. The lifetime of
the data in these directories is independent of the lifetime of any particular
XDC. They exist for the lifetime of the corresponding user account or project.
There are some other relevant details to note in the deployment description above.
- The
selectoris used in conjunction with a service so that this pod is reachable from thejumpcbastion and the https web proxy. - XDCs by default come with a Jupyter notebook interface and the XDC operator sets up environment variables to enable remote access through the https web proxy.
- passwd, and group files are mounted into the XDC from
mergefs. These are files that are managed by the portal and are merged into the XDCs native passwd and group files at instantiation time. They ensure that the proper user and group permissions are set up for each member of the project the XDC belongs to.
Looking at the k8x service associated with this deployment we see the selector tags that make traffic to the pod routable.
We also see that there are two endpoints exposed
- 22 for SSH
- 443 for TLS
note
The naming scheme for XDC services is <xdc_name>-<exp_name>-<proj-name> this
is the naming scheme users employ to access their XDCs. At the time of writing
dots are not allowed in k8s services, so this was the next best thing.
Jumpc
The jumpc deployment is a set of bastion pods and associated k8s services that provide external SSH connectivity to XDCs. The jumpc services expose external addresses that act as targets for the ingress layer.
note
The Merge portal plumbing uses port 2202 for XDC/SSH access as opposed to the
usual 22.
A closer look at the jumpc service shows that the translation between port
2202 and port 22 takes place within this service.
The jumpc pods contain a mount of all the home directories of every user that is on the portal. This is a read-only mount. This mount is necessary for SSH authentication to work. When users upload their SSH pubkeys to the portal, they are placed in their home directories thereby providing access to XDCs through jumpc.
XDC Web Proxy
The XDC web proxy performs a similar function as the SSH bastion. It provides HTTPS proxying services so users can access the Jupyter web interface of their XDCs.
The xdc-web-proxy service exposes a set of external IP addresses as targets
for the ingress layer.
Externally XDC web interfaces are mad accessible through the following addressing scheme
https://xdc.<facility>.mergetb.io/<project>/<experiment>/<xdc>
The XDC web proxy inspects this URL pattern and translates the path into the
<xdc>-<experiment>-<project>
form and routes the request to the corresponding XDC through its k8s service. XDC access is guarded by a web token that is only available to members of the project the XDC belongs to. So even though the HTTPS interface may be guessed by others and is generally exposed, authorization to actually use the XDC is managed by protected tokens.
Taints and Tolerations
The Merge portal uses k8s taints and tolerations to control where pods are scheduled. The general rules are
- core services and general infrastructure get scheduled to
service_workerservers - XDCs get scheduled to
xdc_workerservers
Taints are applied to nodes, and any pod that is to be scheduled to a node must
have tolerations that match the nodes taints. Node taints can be viewed using
kubectl.
Here we show the taints on a service_worker node.
A pod that gets scheduled to this node must have a corresponding toleration, as shown below.
Wireguard
TODO
@glawler
Container Storage Interface
The k8s
Container Storage Interface
(CSI) is the touch point between Kubernetes and the Ceph cluster in the Merge
portal. The machinery that makes this interface work is in the csi namespace.
The particular CSI implementation used by the Merge portal is
ceph-csi. It's deployed through a very
standard set of
ceph-csi templates.
pods
services
daemon sets
deployments
replica sets
The parts of the ceph-csi that are specific to a particular Merge portal is how
the connection to the underlying Ceph cluster is made. This information is
communicated through the ceph-csi-config ConfigMap.
This configuration specifies the addresses of the Ceph monitors and provides the basis for communication between k8s/ceph-csi and the Ceph cluster.
Ceph
The Ceph cluster provides persistent storage for the pods that run on
Kubernetes. By convention these nodes are named st<N> where N is the integer
index of the Ceph node. In the default Merge/Ceph deployment for the portal each
Ceph node runs
- Ceph monitor
- Ceph manager
- An object storage daemon (OSD) for each configured disk.
- A metadata server (MDS) for the mergefs file system.
Basic Monitoring
The basic health status of a Ceph cluster comes through the ceph health
command.
note
In order to use the ceph command, the user invoking the command must be a
member of the ceph group or be root.
The overall status of the cluster can be viewed using ceph status
Monitoring Services
There is also a Ceph web dashboard. Where the dashboard is hosted, is decided by
Ceph. You can see where it is hosted using the ceph mgr command.
The dashboard provides a good deal of useful information about the health and performance of the Ceph cluster. The Merge/Ceph setup also enables the Prometheus monitoring endpoint by default, so operators can hook up Prometheus servers to get Ceph metrics.
Crash Reports
If a Ceph service crashes, crash reports from Ceph may be available.
System Configuration
Each Ceph node has a configuration file located at
/etc/ceph/ceph.conf
that will look similar to this
Systemd Daemons
The Ceph services run as systemd daemons. The Ceph element to systemd service names are as follows.
| Ceph Element | Systemd Service |
|---|---|
| monitor | ceph-mon |
| manager | ceph-mgr@<node> |
| metadata server | ceph-mds@<node> |
| object storage daemon | ceph-osd@<index> |
The status of any of these services can be checked by
and the logs for each service are available through journalctl